DOE
CASE STUDY
What could be simpler than making microwave popcorn🍿? Unfortunately, as everyone who has ever made popcorn knows, it’s nearly impossible to get every kernel of corn to pop. Often a considerable number of inedible “bullets” (unpopped kernels) remain at the bottom of the bag. What causes this loss of popcorn yield? In this case study, three factors were identified:
Diameter of bowls to contain the corn, 10 cm and 15 cm
Microwaving time, 4 minutes and 6 minutes
Power setting of microwave, 75% and 100%
8 runs were performed with 100 grams of corn used in every experiments and the measured variable is the amount of “bullets” formed in grams and data collected are shown below:
Factor A= diameter
Factor B= microwaving time
Factor C= power
Full Factorial Data Analysis
Hyperlink: CPDD DOE Blog- Full factorial.xlsx
To analyse the data, we start by calculating the average mass of the bullets at the different levels for each factor.
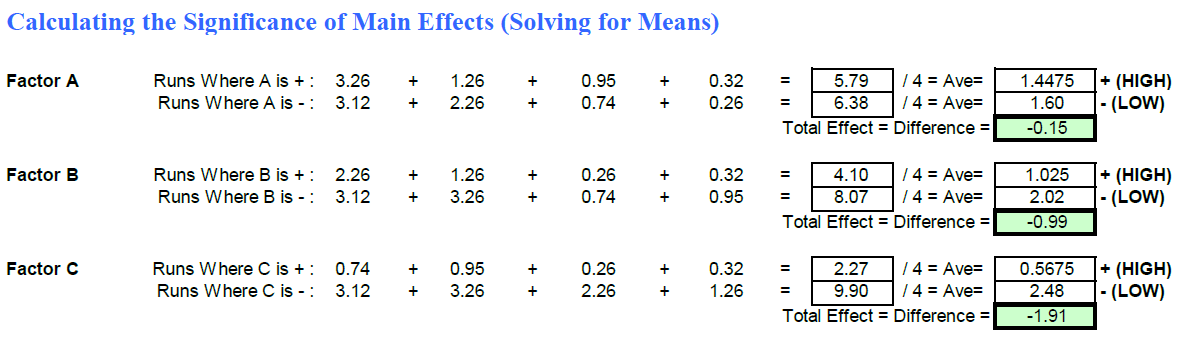
Effects of individual factors
After determining the average, we plot a line graph with the level of factors as the x-axis and the mass of the bullets (response variable) as the y-axis. Plot for all three factors on the same graph.
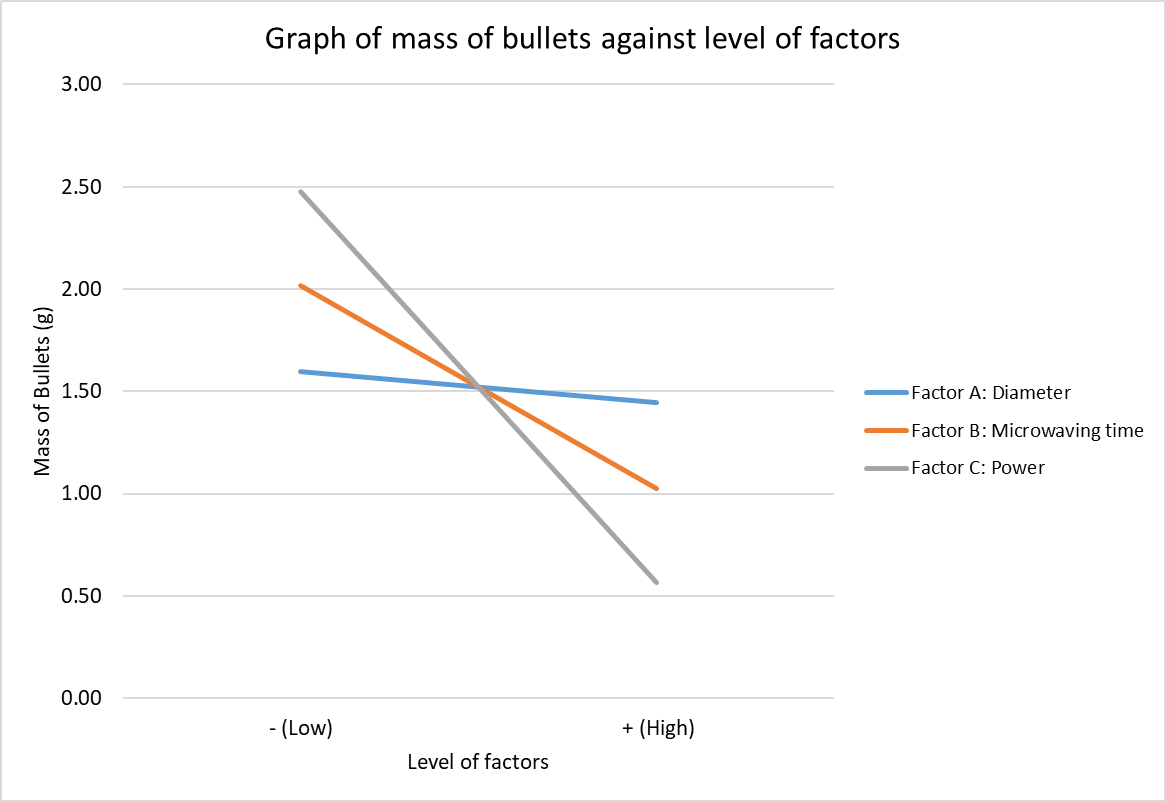
The effects of each factor can be determined by their gradient. A positive gradient indicates a positive effect and a negative gradient indicates a negative effect.
For all 3 factors, the gradients of the lines are negative. Hence, all 3 factors have a negative effect on the mass of bullets.
When the diameter of bowls to contain the corn increases from 10 cm to 15 cm, the mass of bullets formed decreases.
When the microwaving time increases from 4 minutes to 6 minutes, the mass of bullets formed decreases.
When the power setting of microwave increases from 75% to 100%, the mass of bullets formed decreases.
To determine the rankings of the effect of the factors, we shall look at the gradient of the line for each factor. A steeper gradient indicates a larger effect on the mass of bullets formed.
Factor C has the steepest gradient among the 3 factors so it causes the greatest change, hence has the largest effect on the dissolution time when the level has changed.
Factor A has the gentlest gradient among the 3 factors so it causes the least change, hence has the least effect on the dissolution time when the level has changed.
The gradient of factor B is between that of factor A and factor C.
Rankings:
Most significant: Factor C- Power setting of microwave
⇩ Factor B- Microwaving time
Least significant: Factor A- Diameter of Bowls
Interaction effects
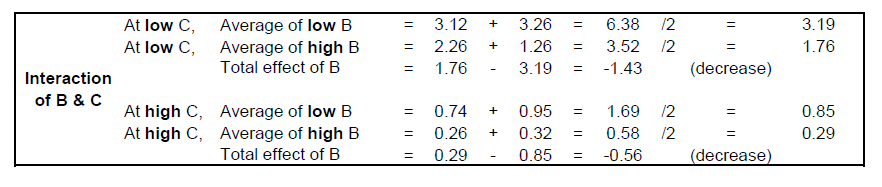
To determine the interaction effect, perform the calculations below.


Plot the graph with the levels of a factor as the x-axis and the mass of bullets formed as the y-axis.
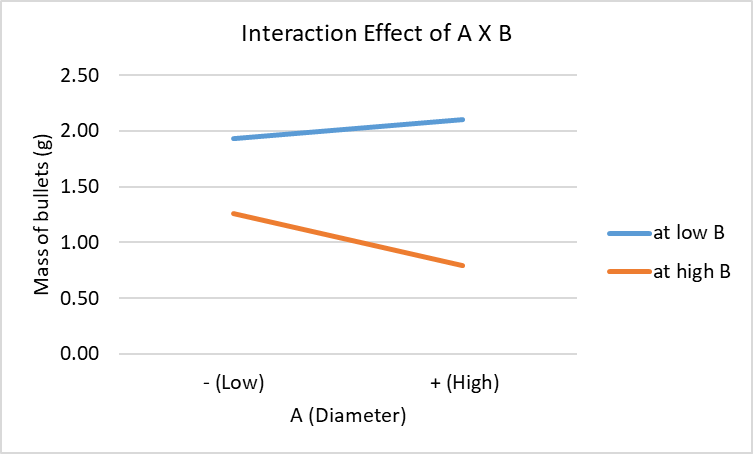
The gradients of both lines are different, with one being positive and the other being negative. Therefore, there is significant interaction between factor A and factor B.
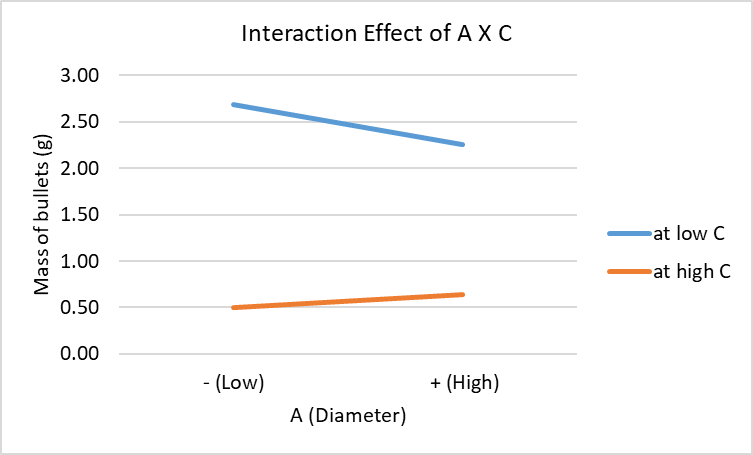
The gradients of both lines are different, with one being positive and the other being negative. Therefore, there is significant interaction between factor A and factor C.
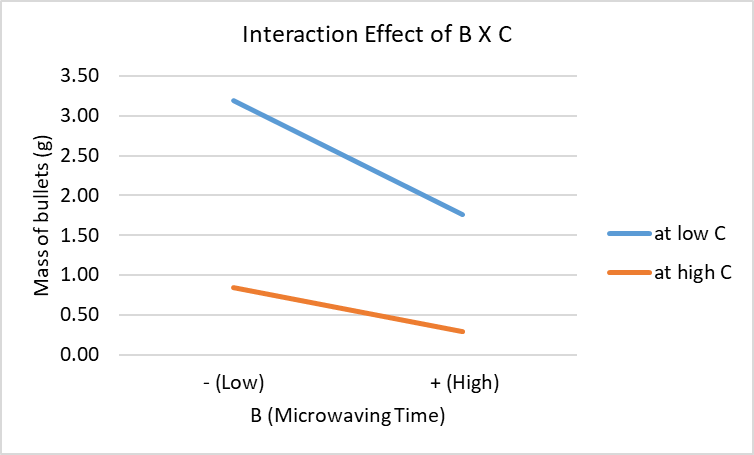
The gradients of both lines are negative and are of different values. Therefore, there is a significant interaction between factor B and factor C.
Conclusion
From the effect of individual factors, it can be seen that all factors have a negative effect on the mass of bullets formed. In order to increase the popcorn 🍿 yield, the mass of bullets formed has to decrease ↓. Hence, to increase↑ the popcorn yield, use a bowl with a larger diameter, microwaving time has to be longer and the power setting of microwave has to be higher.
From the interaction effect of B and C, it can be seen that the mass of bullets will be lower when factor C is high. Factor B also has a decreasing effect on the mass of bullets when factor C increases. Therefore, I would choose a higher microwaving time (factor B is higher) and higher power setting (factor C is higher) to increase my popcorn yield. However, from the interaction effect of A with either B or C, it can be seen that factor A has an increasing effect on the mass of bullets when factor B or C is high. Therefore, when factor B and C is high, I would choose a bowl with smaller diameter (low factor A) so that the mass of bullets formed decreases.
In conclusion, I would choose a bowl with smaller diameter, longer microwaving time and higher power setting on the microwave to increase my popcorn yield. If I could only change one factor, I would increase the power setting on the microwave as it has the largest impact on the mass of bullets formed.
Fractional Factorial Data Analysis
Hyperlink: CPDD DOE Blog- Fractional factorial.xlsx
To do fractional factorial data analysis, I will choose run order 1,2,3 and 6. (Run#2,3,5 & 8 on excel sheet). The 4 runs allows each factor to be varied and each factor is investigated at both high and low levels the same number of times. Statistical Orthogonality is achieved.
Effects of individual factors
To determine the effects of the individual factors, I repeated the same steps as full factorial data analysis. First I determine the average mass of bullets formed for different levels.

Then, I plotted a line graph with the level of factors as the x-axis and the mass of the bullets as the y-axis, with all 3 factors in one graph.

Similarly, the effects of each factor can be determined by their gradient.
The gradient of the line for factor A is positive so factor A has a positive effect on the mass of bullets formed.
The gradients of the lines for factor B and C are negative so both factor B and C have a negative effect on the mass of bullets formed.
When the diameter of bowls to contain the corn increases from 10 cm to 15 cm, the mass of bullets formed increases.
When the microwaving time increases from 4 minutes to 6 minutes, the mass of bullets formed decreases.
When the power setting of microwave increases from 75% to 100%, the mass of bullets formed decreases.
Factor C has the steepest gradient among the 3 factors so it causes the greatest change, hence has the largest effect on the dissolution time when the level has changed.
Factor A has the gentlest gradient among the 3 factors so it causes the least change, hence has the least effect on the dissolution time when the level has changed.
The gradient of factor B is between that of factor A and factor C.
Rankings:
Most significant: Factor C- Power setting of microwave
⇩ Factor B- Microwaving time
Least significant: Factor A- Diameter of Bowls
Factor C has the steepest gradient among the 3 factors so it causes the greatest change, hence has the largest effect on the dissolution time when the level has changed.
Factor A has the gentlest gradient among the 3 factors so it causes the least change, hence has the least effect on the dissolution time when the level has changed.
The gradient of factor B is between that of factor A and factor C.
Conclusion
From the effect of individual factors, it can be seen that factor B and C have a negative effect on the mass of bullets formed while factor A has a positive effect on the mass of bullets formed. In order to increase the popcorn yield, the mass of bullets formed has to decrease. Hence, to increase the popcorn 🍿 yield, use a bowl with a smaller diameter, microwaving time has to be longer and the power setting of microwave has to be higher.
If I could only change one factor, I would increase the power setting on the microwave as it has the largest impact on the mass of bullets formed.
Learning Reflection
DOE was not something new to us. However, at that point in time, I didn’t really understand what was going on and the purpose of it. After the tutorial lesson, I had a better understanding of what DOE is about and how to apply it and analyse the data. I also learnt how to fractionalise correctly and ensure that statistical orthogonality is achieved.
I also learnt to analyse the data properly. It is not just simply seeing the relationship between a single factor and the response variable. For example, using full factorial on the case study, by merely looking at the effect of the individual factor, I would choose to make all 3 factors high to have lesser mass of bullets. However, only when I studied the interaction effect of the factors, I can conclude that factor A should be low while factor B and C are high to have the least mass of bullets formed. This is also supported when I studied the effect of the factors for fractional factorial. Hence, it is important to not only look at the individual effect but as a whole, how the factors interact with each other.
From the pre-practical, practical and the case study, I can also see the difference in results when full factorial and fractional factorial is used. The effect of the individual factors are slightly different between the two. Both methods show that the factor with the most significant effect has the same effect. Therefore, in the future, if I can only make one change to a parameter, I would need to find out the parameter with the most significant effect. I will choose to use fractional factorial method as it saves time with lesser number of experiments and still yield the same result in terms of effect of most significant factor.
DOE is a useful tool that I can use. I can easily calculate the number of experiments needed for a certain number of factors. It provides me with a systematic approach to conduct experiments. Hence, I will be less likely to miss out on important data. I can apply it in my FYP if I were to work on experimentation or in my career in the future.